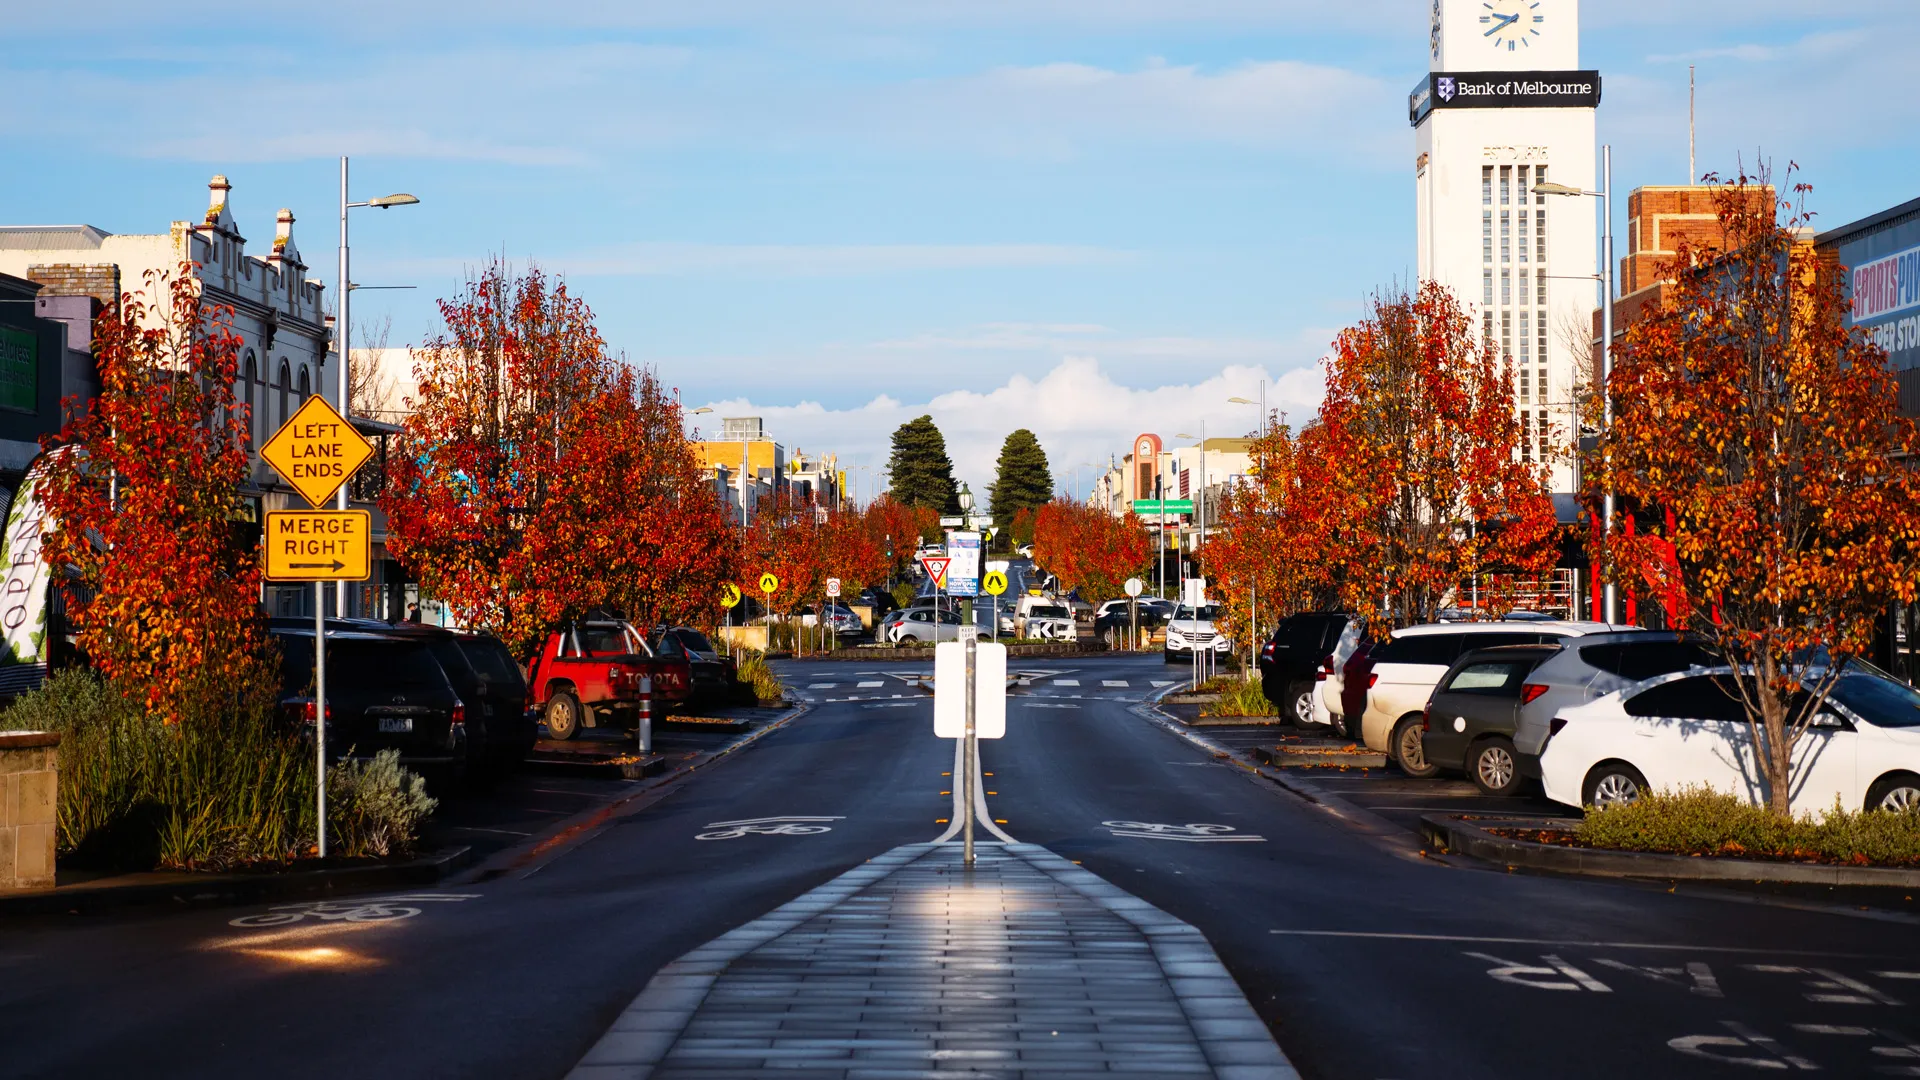
 As the largest Victoria coastal city outside of Port Phillip Bay, Warrnambool is the major service centre in the Great South Coast region.
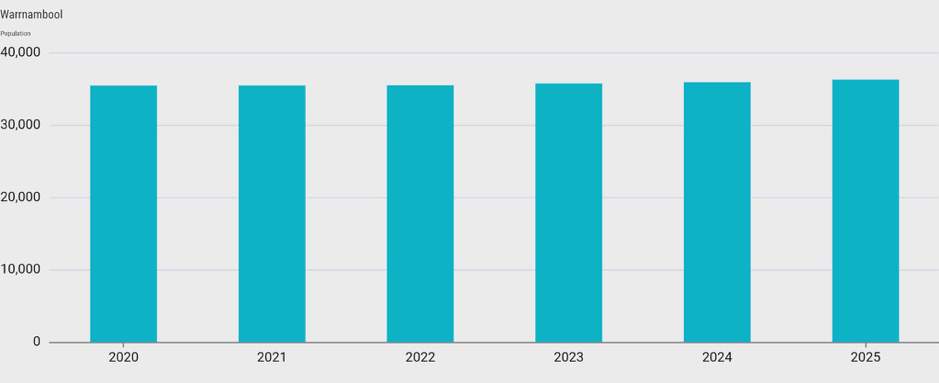
Home to over 36,000 people, Warrnambool supports over 18,500 jobs and has an annual economic output of over $6 billion.
Employment strengths are in the service sectors of health and community, education, food processing, government, retail trade and tourism. Industrial and business activities also occur in the City that supports the broader agricultural and other industry value adding activities.
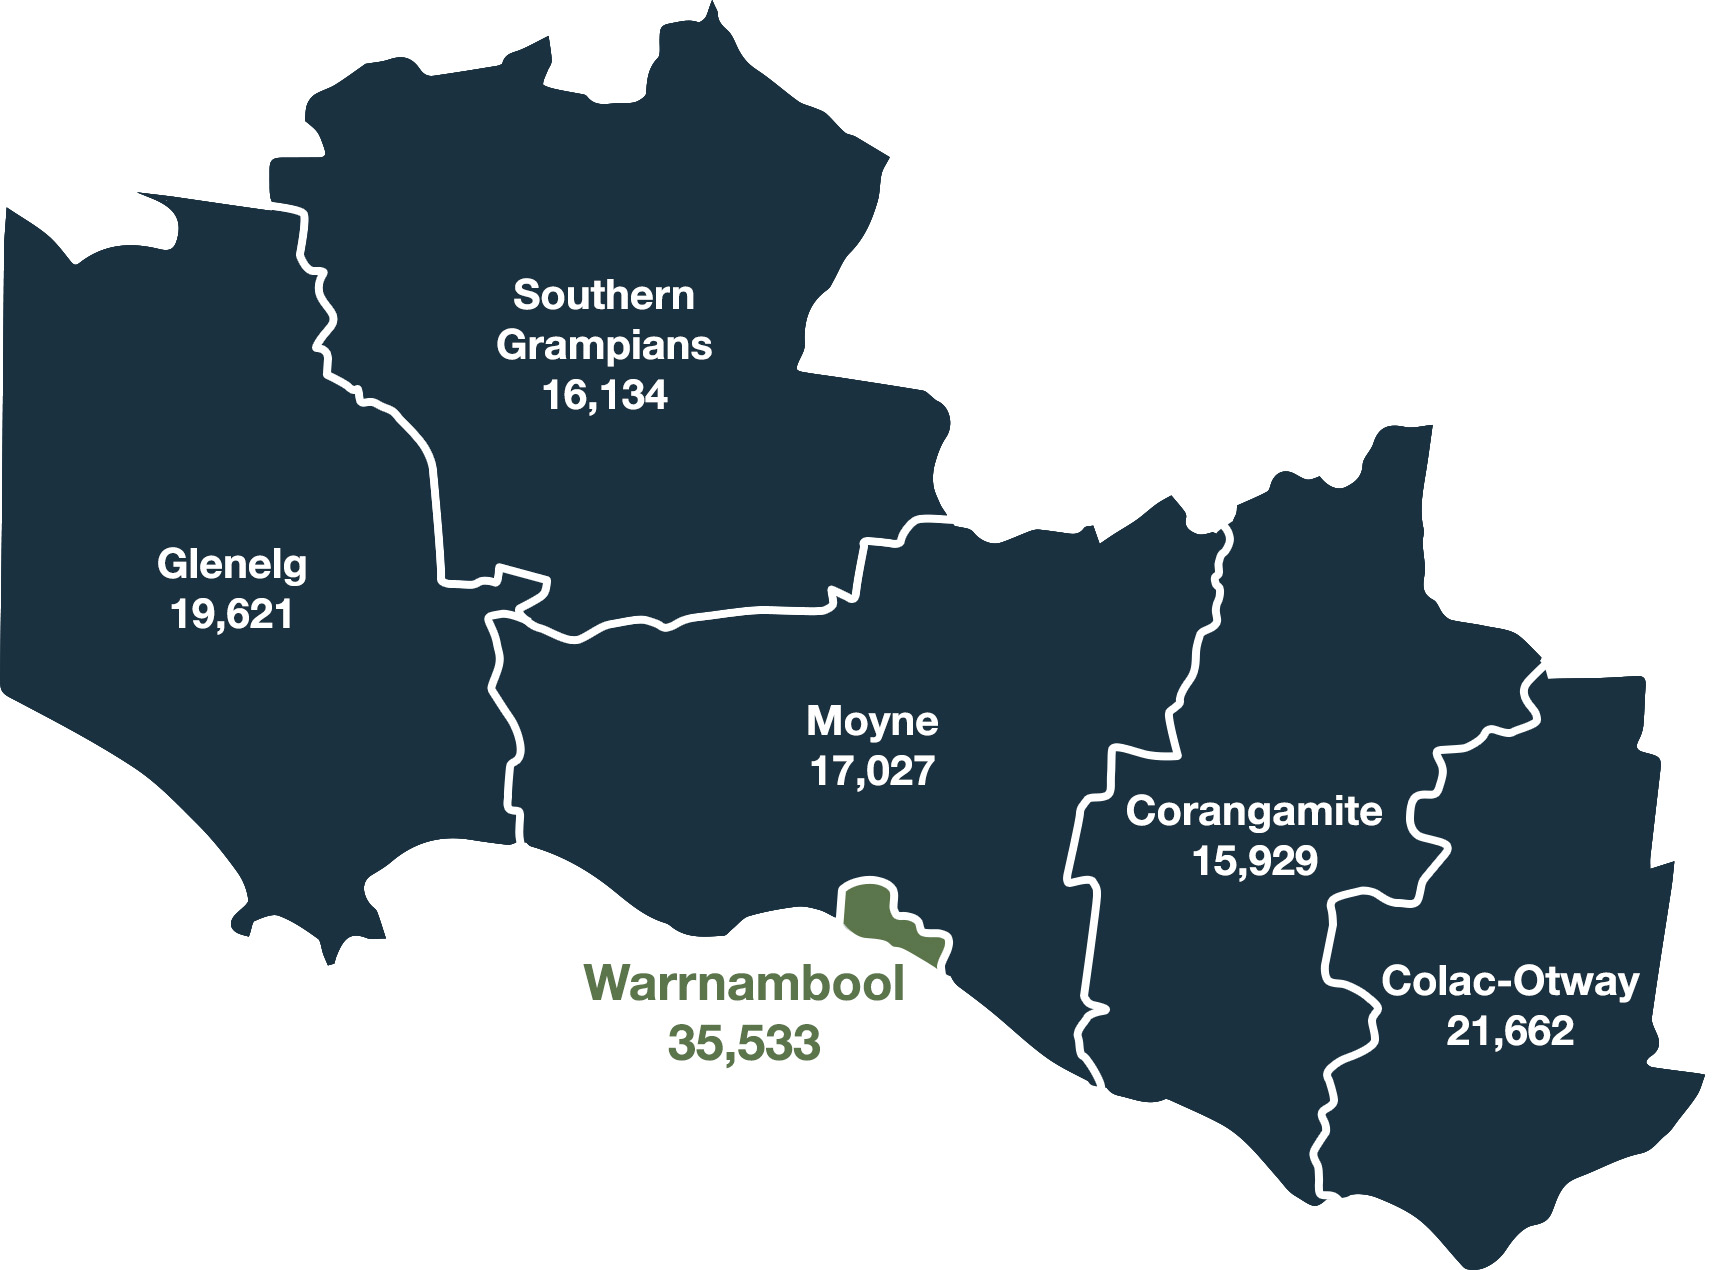
The Great South Coast Region encompasses 6 LGAs; Colac-Otway, Corangamite, Moyne, Warrnambool, Southern Grampians and Glenelg. Collectively making up a population of approximately 126,000.
A comprehensive economic profile of Warrnambool can be sourced directly here.
Economic Profile (as of May 2026)
- Population: estimated 36,255 with a median age of 42 years.
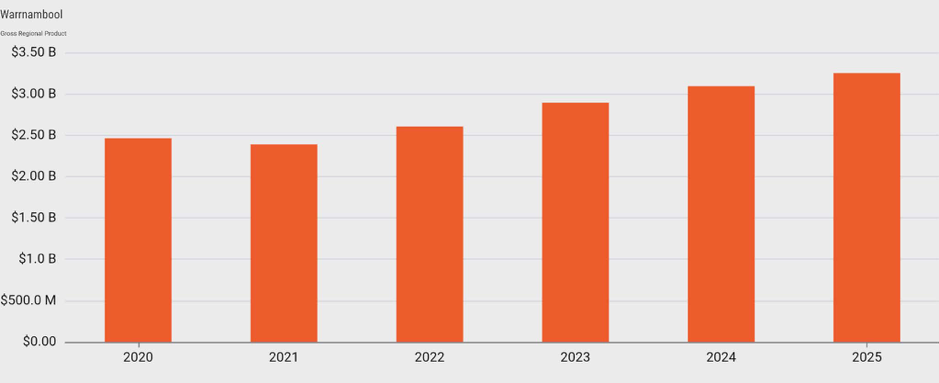
- Gross Regional Product (GRP): $3.2 Billion
Gross regional Product (GRP)
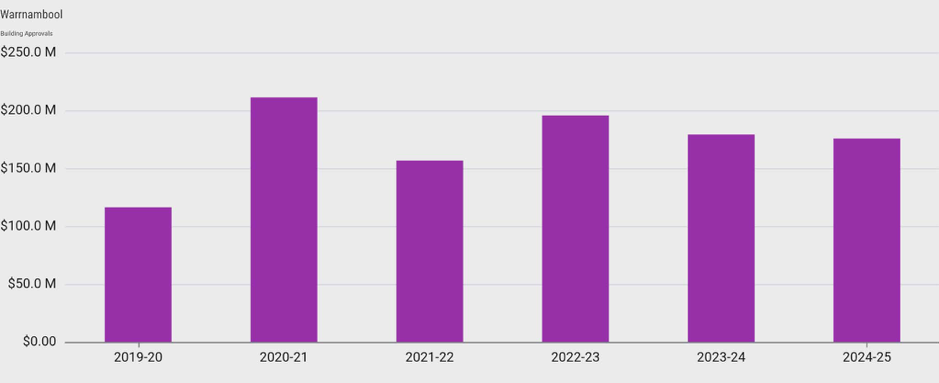
Building Approvals
Business Counts/ Employment
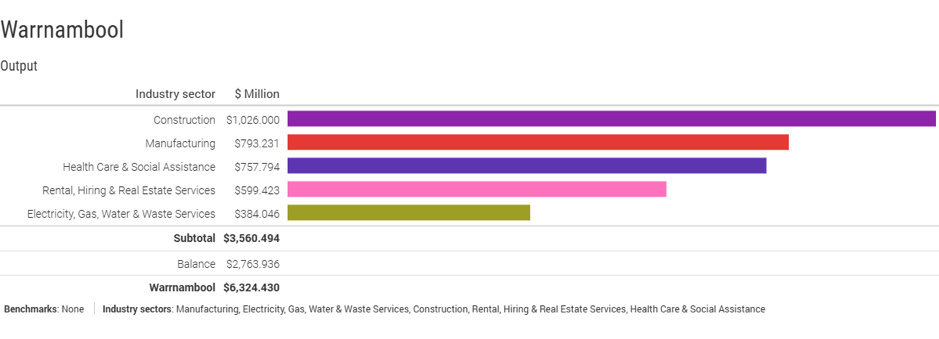
Largest Industries by Output
The Warrnambool economy generates an estimated $6.324 billion in output. This represents 23.7% of the $26.732 billion output generated in the Great South Coast region.
Construction is Warrnambool's largest output generating sector, supporting an estimated annual output of $1.026 billion.
Top 5 Industries by output:
Business Counts
The number of actively trading businesses in Warrnambool in the year ending June 2025 was 3,057
From 2023 to 2025, the annual growth rate for business counts for Warrnambool is estimated at 2.4%
By Staff
| Staff Size | Jun 23 | Jun 24 | Jun 25 |
|---|---|---|---|
| Non Employing | 1634 | 1747 | 1798 |
| 1-4 | 762 | 775 | 762 |
| 5-19 | 416 | 388 | 393 |
| 20-199 | 103 | 110 | 101 |
| 200+ | 3 | 3 | 3 |
| Total | 2918 | 3020 | 3057 |
Spendmapp Data
Who spends money in Warrnambool? May 2025 - April 2026
| Expenditure Type | Value $ |
|---|---|
| Total Local Spend | $1.05B |
| Resident Local Spend | $606.4M |
| Visitor Local Spend | $442.53M |
| Resident Escape Spend | $194.05M |
| Resident Online Spend | $465.91M |
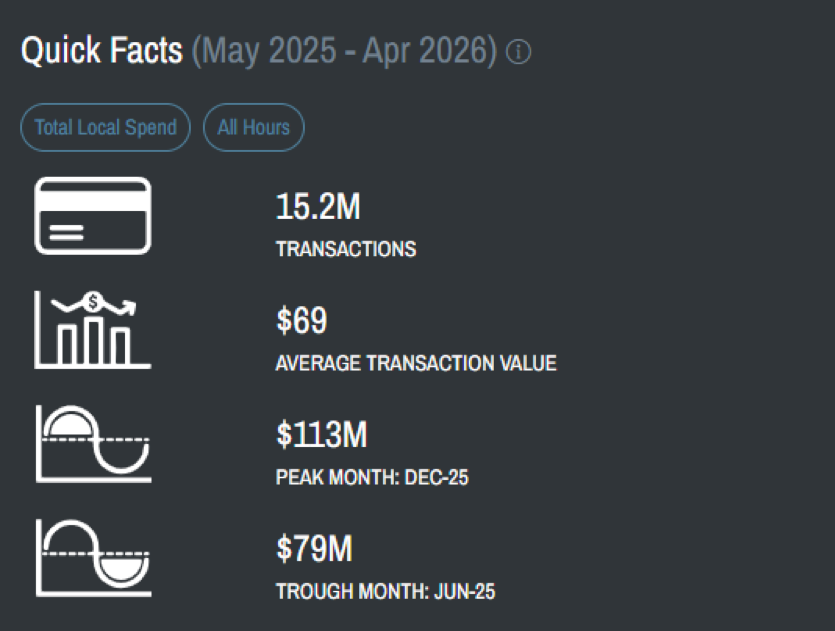
Quick Facts
Year on Year Changes (April 2025 - April 2026)
| Expenditure Type | Apr 2025 (LGA) $ | Apr 2026 (LGA) $ | Change (LGA) % |
|---|---|---|---|
| Total Local Spend | $84.47M | $83.12M | -1.59% |
| Resident Local Spend | $47.30M | $48.29M | 2.10% |
| Visitor Local Spend | $37.17M | $34.83M | -6.29% |
| Resident Escape Spend | $15.76M | $15.25M | -3.18% |
| Resident Online Spend | $34.03M | $37.99M | 11.63% |
Expenditure Categories by Volume – Top 5 (May 2025-26)
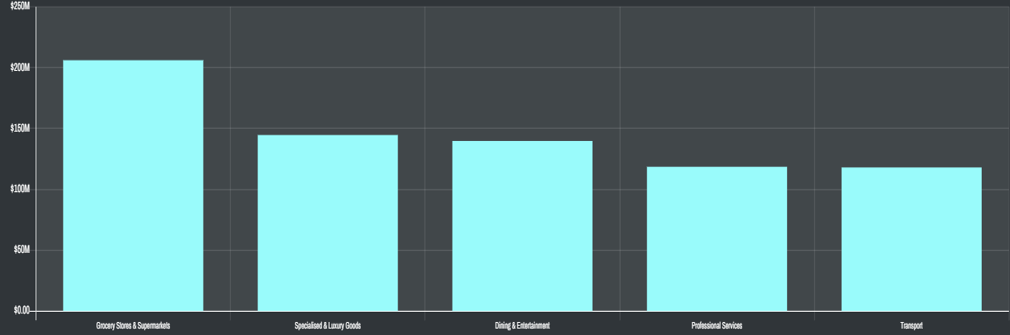
| Expenditure Category | Resident Escape Spend $ | Resident Local Spend $ | Resident Online Spend $ | Total local Spend $ | Visitor local Spend $ |
|---|---|---|---|---|---|
| Grocery Stores and Supermarkets | $19.73M | $143.95M | $15.55M | $206.07M | $62.11M |
| Specialised and Luxury goods | $20.05M | $80.81M | $110.87M | $144.55M | $63.74M |
| Dining and Entertainment | $44.46M | $77.16M | $51.92M | $139.70M | $62.54M |
| Professional Services | $18.61M | $69.87M | $75.61M | $118.49M | $48.62M |
| Transport | $23.51M | $63.37M | $12.98M | $117.95M | $54.58M |
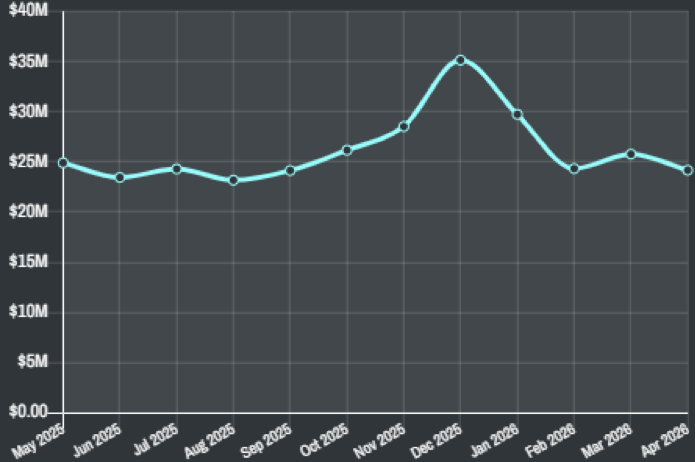
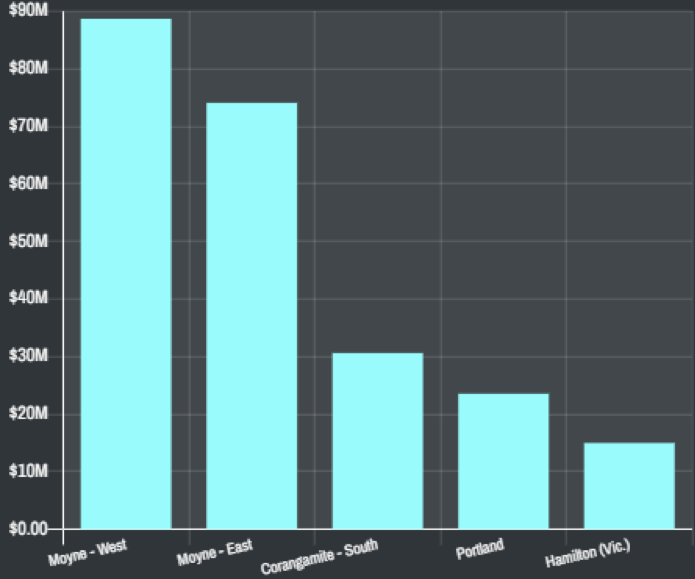
Top Visitor Spend Geographies (May 2025 - Apr 2026)
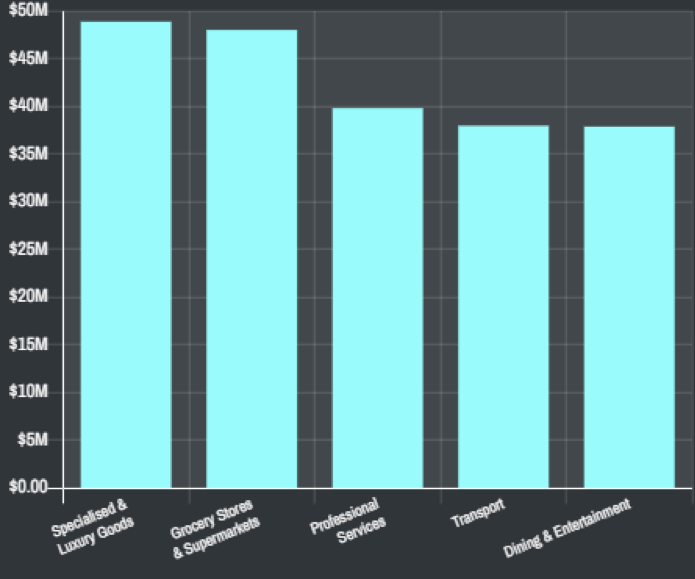
Top Visitor Spend Categories (May 2025 - Apr 2026)
Visitor Spend Time Series (May 2025 - Apr 2026)